What is a baseline?
A baseline is a fixed reference point in time to measure and compare a project’s progress to completion. Capturing and comparing variances between the current and actual schedule and the originally planned schedule is essential for tracking any deviations and allows project teams to quickly re-prioritise to get projects back on track and delivered on time.
The new baseline feature by Smartsheet will help project managers keep projects on track.
What is Smartsheet Baseline?
When running projects, how often do the estimated completion times for individual tasks change? They either run over or are completed earlier than anticipated and suddenly the total project timeline has changed.
The new Smartsheet baseline function allows you to track baseline, actual dates and the variance between the two at individual task and total project level.
This launch is a great step forward for Smartsheet, however there is an aspiration to further develop this functionality. One of the biggest points which is still WIP is being able to surface the baseline bars and modelling in reports and dashboards. Another popular improvement will be to see multiple baselines and see how these have changed over time.

How do you set up the Smartsheet Baselines feature?
- Ensure you have a start and end date in your Smartsheet and be in Gantt view.
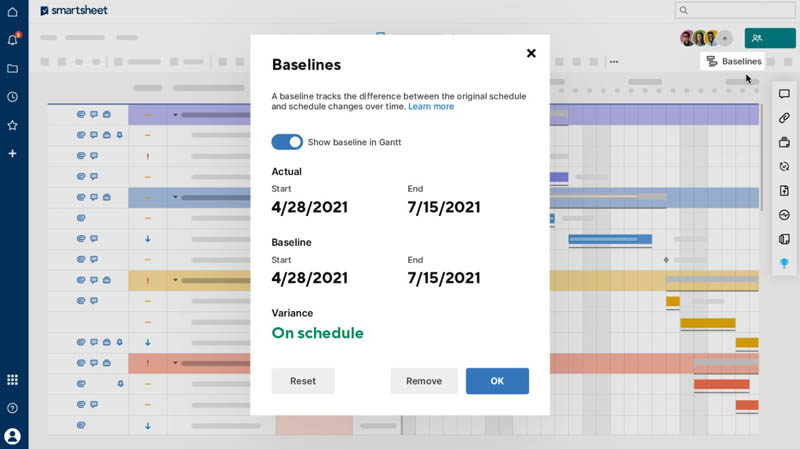
- Click on the Baselines button in the toolbar
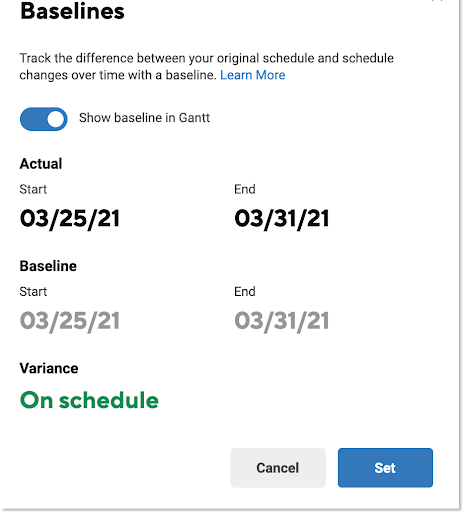
- You will be presented with a screen which shows your actual dates, baselines dates and variances.
- If the toggle is set to “show baseline in Gantt” you will visually see the bars in your Gantt view too. Simply switch this off if not required.
- Click “Set” to enable

Once switched on, you will automatically get three new columns added to your Smartsheet.
- Baseline Start – The date in your start column.
- Baseline Finish – The date in your end column.
- Variance – The difference between Actual End Date and Baseline End Date.
These are:
These columns are read only and non-editable, however they can be referenced in reports and sheet summaries and can feature in formulas.
What’s next?
Once your baselines are set up, you can use the summary screen to view, edit or remove baseline information. As start and end dates are changed in the project plan, the baselines summary will capture the changes.
To open the baselines summary:
- Go to Gantt view
- Click on baselines in the toolbar

In the baseline summary view, you will see the following:
- Show baseline in Gantt – Toggle for enabling baseline in Gantt view.
- Actual – The earliest actual start and latest end dates in your columns.
- Baseline – The earliest and latest baseline start and end dates in your columns established at the time when you enabled the baseline originally.
- Variance – The difference between Actual End Date and Baseline End Date – calculated in decimal days according to the working schedule defined for your project. Variance will display the overall status of your project as Days behind, Days ahead, or On schedule.
- Reset – Establish a new baseline start and end date – see notes below
- Remove – Remove the baseline from your sheet (see the Edit or remove baselines from your sheet section for more information.)
Resetting dates in Smartsheet Baseline
You can choose to reset the data if you wish, however if you would like to keep a history of changes follow these steps otherwise previous data will be lost.
- Rename current columns in your Smartsheet such as Baseline V1, V2 etc and lock the columns.
- Reset baselines which adds 3 new columns but keeps your previous versions
If you would like to discuss this feature or any other Smartsheet feature get in contact with the Cheetah team and we’ll get right back to you.


