Smartsheet increases productivity and effectiveness; it makes collaboration easy; and it makes information accessible and visible to everyone.
But there is more pressure than ever to produce reliable data and use it to improve the quality and speed of decision making.
With 20,000 rows available on every sheet; wouldn’t it be great if Smartsheet could read all your historical data and automatically turn it into actionable information? Now it can.
What is Smartsheet Work Insights?
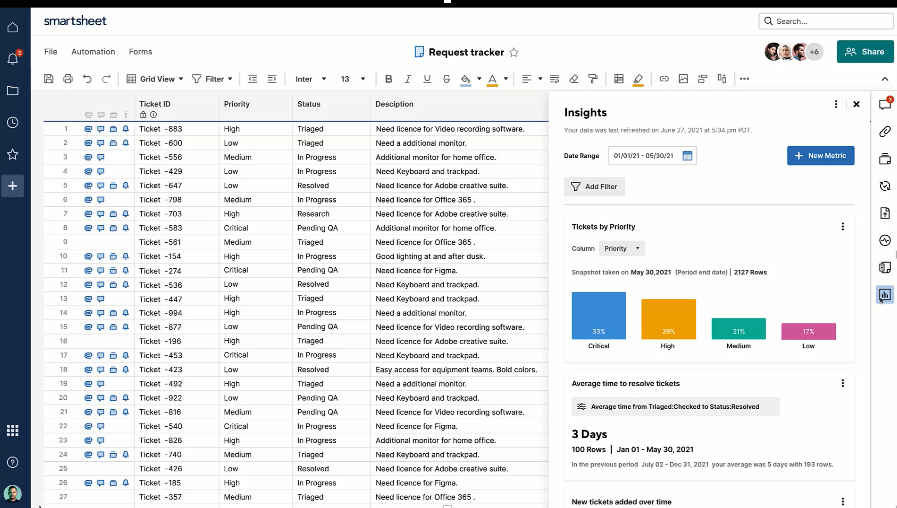
Work Insights is a native functionality built into Smartsheet Enterprise Licenses, that turns information held in a sheet into visuals that illustrate performance progress and trends. What would previously have been a time-consuming task or required multiple reports, can now be done with a few clicks within the sheet being analysed.
What are the benefits of Smartsheet Work Insights?
Smartsheet Work Insights exist to improve the value and interpretation of data and there are two key reasons why they really add value over the various ways that already exist in Smartsheet.
- Smartsheet Work Insights are different to Dashboard charting visuals, with increased flexibility.
- Smartsheet Work Insights can evaluate data in any time period covered by the sheet; this is different to Smartsheet reporting or Sheet Summary formula, both of which are picking up the real time situation. Work Insights can automatically track metrics over time by analysing the date/time stamp recorded for each cell change.
Different types of Work Insights Analysis and Visuals
There are four types of Work Insight Analysis and Visuals available. On first activation in a sheet, each of the first three listed below will appear as a default, but these are not fixed and more can be created depending on the visual type and content required.
The 4 types of Work Insights are: Column snapshots, time series, cross tabs and burndown charts, read on for more information on each work insight type.
1. Column Snapshot
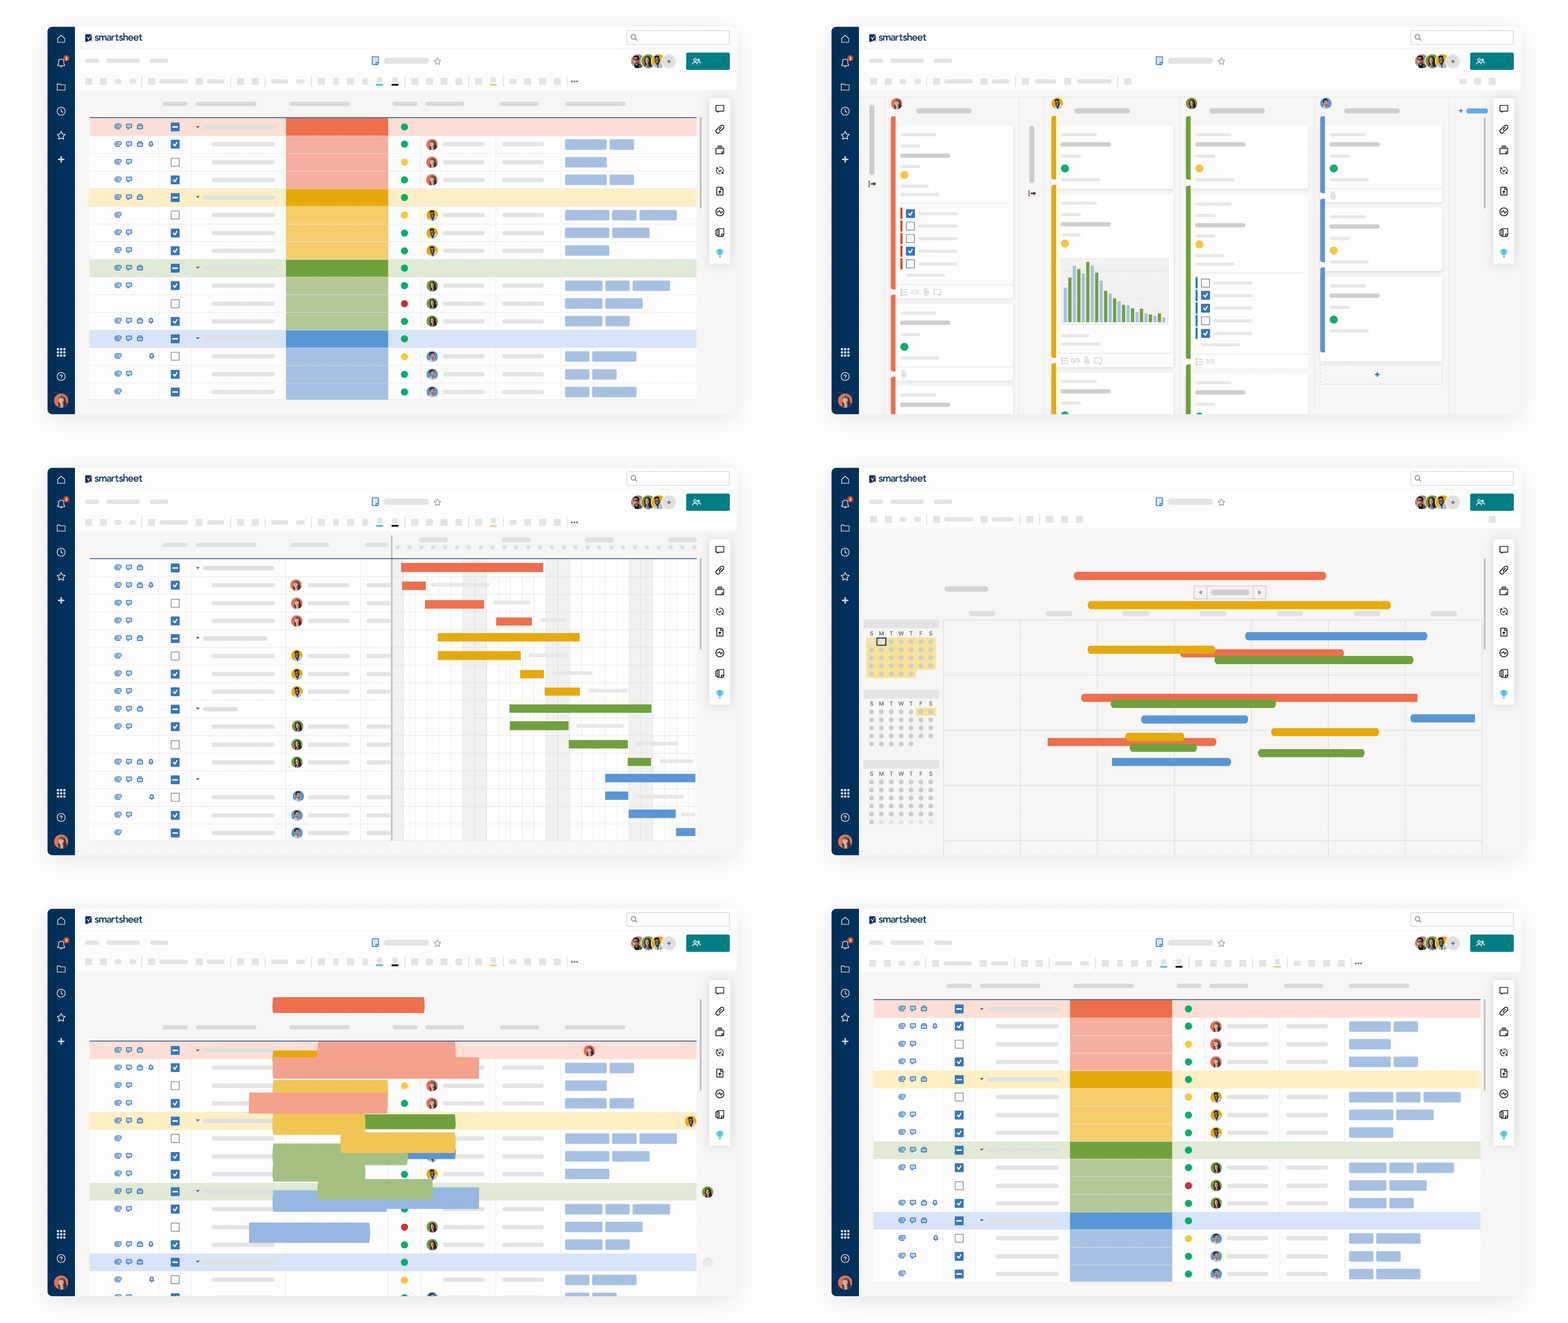
Work Insights Column Snapshot visualises the count of rows split out by the values in the selected column. In the example illustrated here, the number of projects is shown split out by type of drink category.
This type of insight is good for answering questions such as: ‘Which type of work occurs the most often?’ or ‘How is the total number of tickets distributed across departments?’
2. Time Series
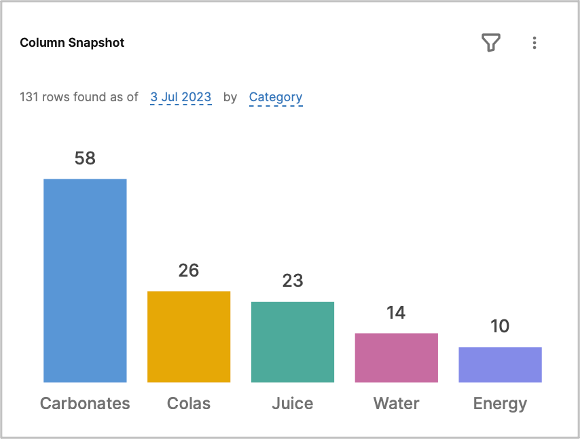
The purpose of the Work Insights Time Series is to identify changes and trends over time. This works brilliantly with a drop-down column displaying all options; albeit that just one option can be selected to be shown.
When created a Time Series visual will default to showing a cumulative row count, but that can be changed to count newly added rows only. There are three Time Series options available: month, week and day.
It’s simply a click on a button to move between them and choose the time period to be reviewed. This visual type answers questions such as: ‘Is there a consistent day of the week that we receive most requests?’ or ‘Has the type of complaint we receive changed over time?’ or ‘When did we onboard most new staff last year?’
3. Cross Tab
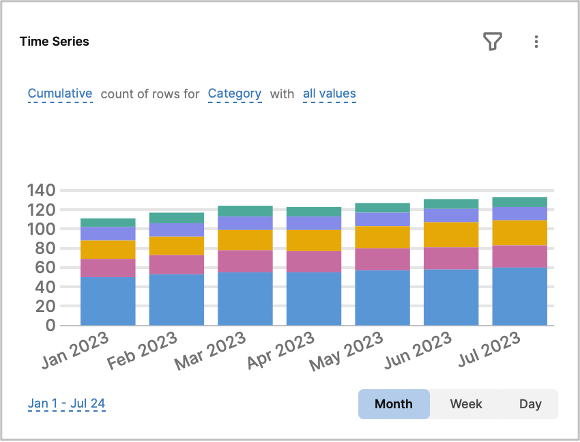
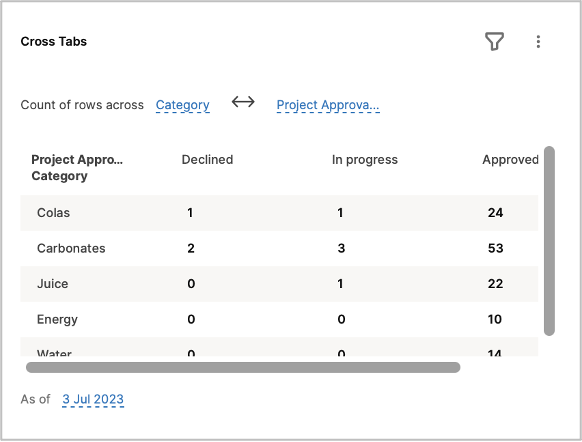
Work Insights Cross Tab is a small, two-dimensional pivot table. Select two columns to give a count at the cross points. In the example shown here the category of drink (vertical) is shown against the number of projects by approval status (horizontal).
Cross Tab is great for answering questions such as ‘What is the stage of each sales opportunity by sale person?’; ‘How many high priority incidents are blocked?’ or ‘By department, how many annual reviews are outstanding?’. The option to add heat map colouring makes it even easier to identify key information detail.
4. Burndown Chart
This visual is for use in certain types of situations – where a specified effort is expended within a bounded timeframe – so it works slightly differently to the other visuals. If you have never used a Burndown Chart before, this is what you need to know:
- Burndown Charts are predominantly used in IT to track ‘effort’ in time bounded sprints.
- Effort is a metric to be tracked, commonly time or spend is used as a proxy for effort.
For a Burndown Chart to work correctly, the Smartsheet needs to contain the following:
- A column to track the effort.
- A column that indicates the item is completed i.e., that effort has been ‘burnt’.
- A column that identifies if a row must be included. Commonly it is a column identifying which sprint the row is included in; it may equally be a phase or a stage.
- You do not need to include a date column; Work Insights will identify the burndown using the date each row is marked as completed.
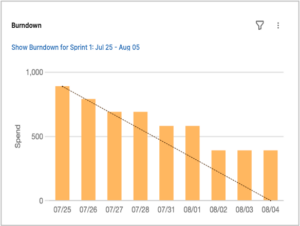
When a date range to be shown on the chart is selected, a linear regression line – the burndown – will be automatically added to the chart. The date range chosen is assumed to be the period in which the entire effort will be expended.
In the example shown, by the end date, the line (the expected burndown) is at zero, but the bar (the actual burndown) is not, indicating that the sprint has not been delivered to plan, and is running over time.
Editing a Work Insight
When editing, each Work Insight can:
- Be customised by clicking on its blue text to select different columns or dates to display.
- Have a filter applied.
- Have the applicable date or date range changed.
- Be renamed.
- Be duplicated and then altered to give a range across similar dimensions.
- Be deleted.
Work Insights can be created and/or edited by sheet owners, admins and editors.
How to get started with Smartsheet Work Insights
Like all the best Smartsheet functionality, there is a pop-out panel on the sheet.
Open the sheet to be used, go to the right hand sidebar and select the Work Insights icon (the little chart as shown).
When this is initiated for the first time, it will take a minute or so for Work Insights to process all the information on the sheet. If it is a really large sheet, it may take a few minutes, but don’t worry, this is normal.
Once the information has been processed, the default visuals will then appear. While the pop-out panel is really handy, it is too small to get a good view of all the visuals so use the outward facing arrow buttons at the top of the panel to open it out fully.
In this view, start to change the default visuals to best meet your needs. To add more visuals, use the blue +Add insight button. To return to the sheet and panel view click either the inward facing arrows or the back to sheet arrow.
Our YouTube video will walk you through how to navigate, create and change all four Work Insight types.
Enjoy the benefits of better, faster decision-making
Better, faster decisions benefit any business or organisation, and using Smartsheet Work Insights with its great quality visuals and detailed data makes it possible.
Once you are experiencing the benefits of Work Insights, there is another brilliant tool exclusive to Smartsheet Enterprise licenses for you to try.
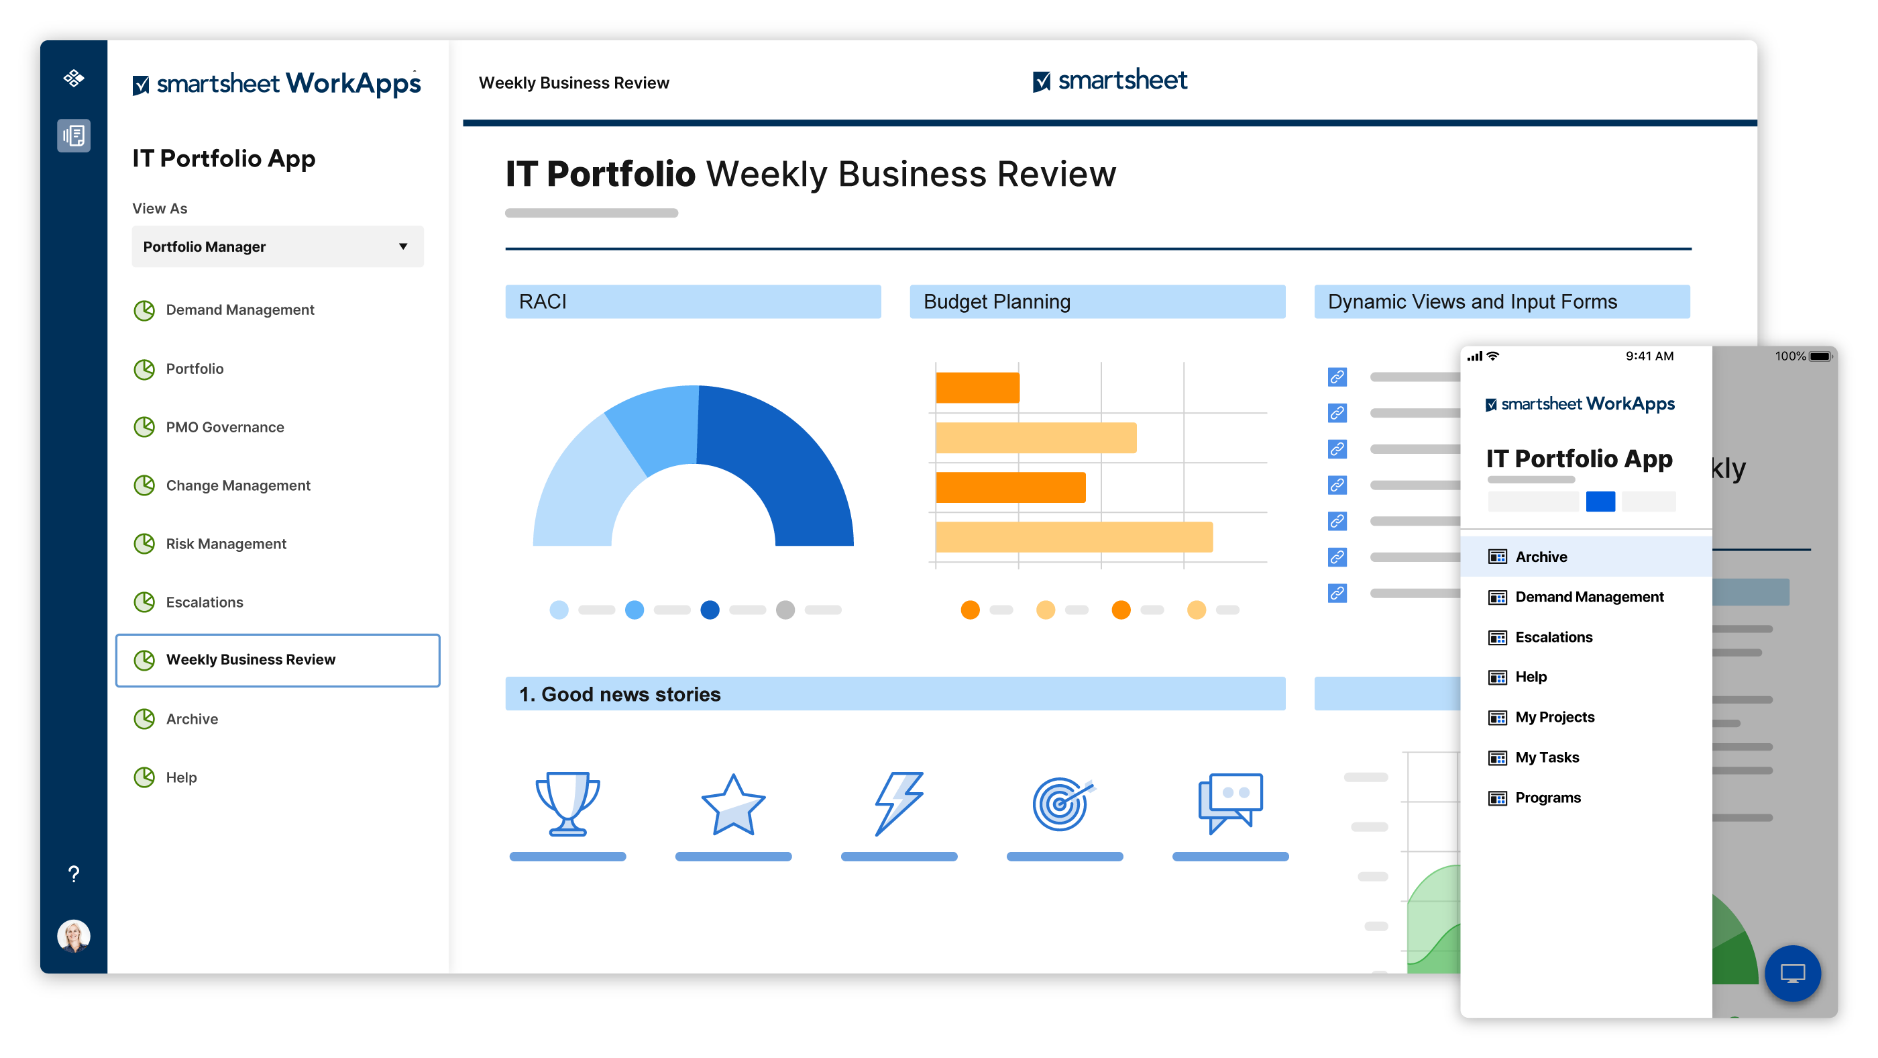
The Smartsheet Work App is a brilliant way to package your Smartsheet solution in a way that makes navigation and access control easier, so you can better manage access to your solution.
Work Apps are available on laptops and desktops too, which makes them brilliant for field-based teams as it is easier to work on a smaller device screen. For more information on creating your own Smartsheet Work App view our video tutorial.
Advantages of Smartsheet Work Apps
It is composed of items and content that are already in use but has three distinct advantages:
- Streamlined access: it presents users with only the items they need and saves them from having to hunt for them.
- Access control: users are assigned to roles to manage access, which then have permissions set against them. Users don’t have to be shared to an underlying sheet to see its information in a report, which is very different to ‘classic’ Smartsheet.
- Simplified view on mobile or tablet: image tiles are the access points, and using role-based views reduces the number of visible items, giving you a cleaner, easier navigation view.
-
Get in touch
If you’re ready to transform your business with Smartsheet or simply want further advice about Smartsheet Work Insights or Work Apps, get in touch to tell us about your requirements.


